
Advanced Search: Build a Custom Dashboard
In the fields below, search for indicators by location, topics, population, classification, subgroup, or comparison. No fields are required, but we suggest selecting a location or two to start. In the additional search options section, select options to group and order search results. To learn more about how to customize a dashboard, see our help center.
Visit the Indicator List Page to see the full list of indicators and locations available on the site.
Search Results:
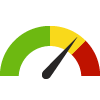
Indicator Gauge Icon Legend
Legend Colors
Red is bad, green is good, blue is not statistically different/neutral.
Compared to Distribution
 the value is in the best half of communities.
 the value is in the 2nd worst quarter of communities.
 the value is in the worst quarter of communities.
Compared to Target
 meets target;
  does not meet target.
Compared to a Single Value
 lower than the comparison value;
 higher than the comparison value;
 not statistically different from comparison value.
Trend

 non-significant change over time;
 significant change over time;
  no change over time.
Compared to Prior Value
 higher than the previous measurement period;
 lower than the previous measurement period;
 no statistically different change from previous measurement period.
Health / Mental Health & Mental Disorders
Adults Ever Diagnosed with Depression County: Hood River
Adults Ever Diagnosed with Depression County: Hood River
23.3%
(2021)
Compared to:

OR Counties
The distribution is based on data from 36 Oregon counties.
U.S. Counties
The distribution is based on data from 3,074 U.S. counties and county equivalents.
US Value
(19.5%)
The regional value is compared to the national value.
Adults Ever Diagnosed with Depression County: Wasco
Adults Ever Diagnosed with Depression County: Wasco
24.5%
(2021)
Compared to:


OR Counties
The distribution is based on data from 36 Oregon counties.
U.S. Counties
The distribution is based on data from 3,074 U.S. counties and county equivalents.
US Value
(19.5%)
The regional value is compared to the national value.
Adults Ever Diagnosed with Depression Census Place: Cascade Locks
Adults Ever Diagnosed with Depression Census Place: Cascade Locks
28.1%
(2021)
Compared to:

OR Census Places
The distribution is based on data from 367 locales.
U.S. Census Places
The distribution is based on data from 27,528 U.S. Census Places.
Hood River, OR County Value
(23.3%)
The regional value is compared to the Hood River County value.
US Value
(19.5%)
The regional value is compared to the national value.
Adults Ever Diagnosed with Depression Census Place: Chenoweth
Adults Ever Diagnosed with Depression Census Place: Chenoweth
26.4%
(2021)
Compared to:
OR Census Places
The distribution is based on data from 367 locales.
U.S. Census Places
The distribution is based on data from 27,528 U.S. Census Places.
Wasco, OR County Value
(24.5%)
The regional value is compared to the Wasco County value.
US Value
(19.5%)
The regional value is compared to the national value.
Adults Ever Diagnosed with Depression Census Place: Dufur
Adults Ever Diagnosed with Depression Census Place: Dufur
25.5%
(2021)
Compared to:
OR Census Places
The distribution is based on data from 367 locales.
U.S. Census Places
The distribution is based on data from 27,528 U.S. Census Places.
Wasco, OR County Value
(24.5%)
The regional value is compared to the Wasco County value.
US Value
(19.5%)
The regional value is compared to the national value.
Adults Ever Diagnosed with Depression Census Place: Hood River
Adults Ever Diagnosed with Depression Census Place: Hood River
24.7%
(2021)
Compared to:
OR Census Places
The distribution is based on data from 367 locales.
U.S. Census Places
The distribution is based on data from 27,528 U.S. Census Places.
Hood River, OR County Value
(23.3%)
The regional value is compared to the Hood River County value.
US Value
(19.5%)
The regional value is compared to the national value.
Adults Ever Diagnosed with Depression Census Place: Maupin
Adults Ever Diagnosed with Depression Census Place: Maupin
23.3%
(2021)
Compared to:
OR Census Places
The distribution is based on data from 367 locales.
U.S. Census Places
The distribution is based on data from 27,528 U.S. Census Places.
Wasco, OR County Value
(24.5%)
The regional value is compared to the Wasco County value.
US Value
(19.5%)
The regional value is compared to the national value.
Adults Ever Diagnosed with Depression Census Place: Mosier
Adults Ever Diagnosed with Depression Census Place: Mosier
24.5%
(2021)
Compared to:
OR Census Places
The distribution is based on data from 367 locales.
U.S. Census Places
The distribution is based on data from 27,528 U.S. Census Places.
Wasco, OR County Value
(24.5%)
The regional value is compared to the Wasco County value.
US Value
(19.5%)
The regional value is compared to the national value.
Adults Ever Diagnosed with Depression Census Place: Mount Hood
Adults Ever Diagnosed with Depression Census Place: Mount Hood
26.0%
(2021)
Compared to:
OR Census Places
The distribution is based on data from 367 locales.
U.S. Census Places
The distribution is based on data from 27,528 U.S. Census Places.
Hood River, OR County Value
(23.3%)
The regional value is compared to the Hood River County value.
US Value
(19.5%)
The regional value is compared to the national value.
Adults Ever Diagnosed with Depression Census Place: Odell
Adults Ever Diagnosed with Depression Census Place: Odell
23.8%
(2021)
Compared to:
OR Census Places
The distribution is based on data from 367 locales.
U.S. Census Places
The distribution is based on data from 27,528 U.S. Census Places.
Hood River, OR County Value
(23.3%)
The regional value is compared to the Hood River County value.
US Value
(19.5%)
The regional value is compared to the national value.
Adults Ever Diagnosed with Depression Census Place: Parkdale
Adults Ever Diagnosed with Depression Census Place: Parkdale
26.3%
(2021)
Compared to:
OR Census Places
The distribution is based on data from 367 locales.
U.S. Census Places
The distribution is based on data from 27,528 U.S. Census Places.
Hood River, OR County Value
(23.3%)
The regional value is compared to the Hood River County value.
US Value
(19.5%)
The regional value is compared to the national value.
Adults Ever Diagnosed with Depression Census Place: Pine Grove
Adults Ever Diagnosed with Depression Census Place: Pine Grove
25.8%
(2021)
Compared to:
OR Census Places
The distribution is based on data from 367 locales.
U.S. Census Places
The distribution is based on data from 27,528 U.S. Census Places.
Wasco, OR County Value
(24.5%)
The regional value is compared to the Wasco County value.
US Value
(19.5%)
The regional value is compared to the national value.
Adults Ever Diagnosed with Depression Census Place: Pine Hollow
Adults Ever Diagnosed with Depression Census Place: Pine Hollow
23.1%
(2021)
Compared to:
OR Census Places
The distribution is based on data from 367 locales.
U.S. Census Places
The distribution is based on data from 27,528 U.S. Census Places.
Wasco, OR County Value
(24.5%)
The regional value is compared to the Wasco County value.
US Value
(19.5%)
The regional value is compared to the national value.
Adults Ever Diagnosed with Depression Census Place: Rowena
Adults Ever Diagnosed with Depression Census Place: Rowena
25.3%
(2021)
Compared to:

OR Census Places
The distribution is based on data from 367 locales.
U.S. Census Places
The distribution is based on data from 27,528 U.S. Census Places.
Wasco, OR County Value
(24.5%)
The regional value is compared to the Wasco County value.
US Value
(19.5%)
The regional value is compared to the national value.
Adults Ever Diagnosed with Depression Census Place: The Dalles
Adults Ever Diagnosed with Depression Census Place: The Dalles
25.1%
(2021)
Compared to:
OR Census Places
The distribution is based on data from 367 locales.
U.S. Census Places
The distribution is based on data from 27,528 U.S. Census Places.
Wasco, OR County Value
(24.5%)
The regional value is compared to the Wasco County value.
US Value
(19.5%)
The regional value is compared to the national value.
Adults Ever Diagnosed with Depression Census Place: Tygh Valley
Adults Ever Diagnosed with Depression Census Place: Tygh Valley
24.3%
(2021)
Compared to:
OR Census Places
The distribution is based on data from 367 locales.
U.S. Census Places
The distribution is based on data from 27,528 U.S. Census Places.
Wasco, OR County Value
(24.5%)
The regional value is compared to the Wasco County value.
US Value
(19.5%)
The regional value is compared to the national value.
Adults Ever Diagnosed with Depression Census Place: Wamic
Adults Ever Diagnosed with Depression Census Place: Wamic
24.0%
(2021)
Compared to:
OR Census Places
The distribution is based on data from 367 locales.
U.S. Census Places
The distribution is based on data from 27,528 U.S. Census Places.
Wasco, OR County Value
(24.5%)
The regional value is compared to the Wasco County value.
US Value
(19.5%)
The regional value is compared to the national value.
Adults Ever Diagnosed with Depression Zip Code: 97001
Adults Ever Diagnosed with Depression Zip Code: 97001
27.2%
(2021)
Compared to:
OR Zip Codes
The distribution is based on data from 408 Oregon zip codes.
U.S. Zip Codes
The distribution is based on data from 31,435 U.S. zip codes.
Wasco, OR County Value
(24.5%)
The regional value is compared to the Wasco County value.
US Value
(19.5%)
The regional value is compared to the national value.
Adults Ever Diagnosed with Depression Zip Code: 97014
Adults Ever Diagnosed with Depression Zip Code: 97014
28.0%
(2021)
Compared to:
OR Zip Codes
The distribution is based on data from 408 Oregon zip codes.
U.S. Zip Codes
The distribution is based on data from 31,435 U.S. zip codes.
Hood River, OR County Value
(23.3%)
The regional value is compared to the Hood River County value.
US Value
(19.5%)
The regional value is compared to the national value.
Adults Ever Diagnosed with Depression Zip Code: 97021
Adults Ever Diagnosed with Depression Zip Code: 97021
25.3%
(2021)
Compared to:
OR Zip Codes
The distribution is based on data from 408 Oregon zip codes.
U.S. Zip Codes
The distribution is based on data from 31,435 U.S. zip codes.
Wasco, OR County Value
(24.5%)
The regional value is compared to the Wasco County value.
US Value
(19.5%)
The regional value is compared to the national value.
Adults Ever Diagnosed with Depression Zip Code: 97031
Adults Ever Diagnosed with Depression Zip Code: 97031
24.1%
(2021)
Compared to:
OR Zip Codes
The distribution is based on data from 408 Oregon zip codes.
U.S. Zip Codes
The distribution is based on data from 31,435 U.S. zip codes.
Hood River, OR County Value
(23.3%)
The regional value is compared to the Hood River County value.
US Value
(19.5%)
The regional value is compared to the national value.
Adults Ever Diagnosed with Depression Zip Code: 97037
Adults Ever Diagnosed with Depression Zip Code: 97037
24.2%
(2021)
Compared to:
OR Zip Codes
The distribution is based on data from 408 Oregon zip codes.
U.S. Zip Codes
The distribution is based on data from 31,435 U.S. zip codes.
Wasco, OR County Value
(24.5%)
The regional value is compared to the Wasco County value.
US Value
(19.5%)
The regional value is compared to the national value.
Adults Ever Diagnosed with Depression Zip Code: 97040
Adults Ever Diagnosed with Depression Zip Code: 97040
25.0%
(2021)
Compared to:
OR Zip Codes
The distribution is based on data from 408 Oregon zip codes.
U.S. Zip Codes
The distribution is based on data from 31,435 U.S. zip codes.
Wasco, OR County Value
(24.5%)
The regional value is compared to the Wasco County value.
US Value
(19.5%)
The regional value is compared to the national value.
Adults Ever Diagnosed with Depression Zip Code: 97041
Adults Ever Diagnosed with Depression Zip Code: 97041
25.5%
(2021)
Compared to:
OR Zip Codes
The distribution is based on data from 408 Oregon zip codes.
U.S. Zip Codes
The distribution is based on data from 31,435 U.S. zip codes.
Hood River, OR County Value
(23.3%)
The regional value is compared to the Hood River County value.
US Value
(19.5%)
The regional value is compared to the national value.
Adults Ever Diagnosed with Depression Zip Code: 97058
Adults Ever Diagnosed with Depression Zip Code: 97058
25.1%
(2021)
Compared to:
OR Zip Codes
The distribution is based on data from 408 Oregon zip codes.
U.S. Zip Codes
The distribution is based on data from 31,435 U.S. zip codes.
Wasco, OR County Value
(24.5%)
The regional value is compared to the Wasco County value.
US Value
(19.5%)
The regional value is compared to the national value.
Adults Ever Diagnosed with Depression Zip Code: 97063
Adults Ever Diagnosed with Depression Zip Code: 97063
23.3%
(2021)
Compared to:
OR Zip Codes
The distribution is based on data from 408 Oregon zip codes.
U.S. Zip Codes
The distribution is based on data from 31,435 U.S. zip codes.
Wasco, OR County Value
(24.5%)
The regional value is compared to the Wasco County value.
US Value
(19.5%)
The regional value is compared to the national value.
Adults Ever Diagnosed with Depression Zip Code: 97761
Adults Ever Diagnosed with Depression Zip Code: 97761
28.5%
(2021)
Compared to:
OR Zip Codes
The distribution is based on data from 408 Oregon zip codes.
U.S. Zip Codes
The distribution is based on data from 31,435 U.S. zip codes.
Wasco, OR County Value
(24.5%)
The regional value is compared to the Wasco County value.
Jefferson, OR County Value
(24.5%)
The regional value is compared to the Jefferson County value.
US Value
(19.5%)
The regional value is compared to the national value.
Adults Ever Diagnosed with Depression Census Tract: 41027950100
Adults Ever Diagnosed with Depression Census Tract: 41027950100
26.1%
(2021)
Compared to:
OR Census Tracts
The distribution is based on data from 825 Oregon census tracts.
U.S. Census Tracts
The distribution is based on data from 68,167 U.S. census tracts.
Hood River, OR County Value
(23.3%)
The regional value is compared to the Hood River County value.
US Value
(19.5%)
The regional value is compared to the national value.
Adults Ever Diagnosed with Depression Census Tract: 41027950200
Adults Ever Diagnosed with Depression Census Tract: 41027950200
23.4%
(2021)
Compared to:
OR Census Tracts
The distribution is based on data from 825 Oregon census tracts.
U.S. Census Tracts
The distribution is based on data from 68,167 U.S. census tracts.
Hood River, OR County Value
(23.3%)
The regional value is compared to the Hood River County value.
US Value
(19.5%)
The regional value is compared to the national value.
Adults Ever Diagnosed with Depression Census Tract: 41027950300
Adults Ever Diagnosed with Depression Census Tract: 41027950300
24.9%
(2021)
Compared to:
OR Census Tracts
The distribution is based on data from 825 Oregon census tracts.
U.S. Census Tracts
The distribution is based on data from 68,167 U.S. census tracts.
Hood River, OR County Value
(23.3%)
The regional value is compared to the Hood River County value.
US Value
(19.5%)
The regional value is compared to the national value.
Adults Ever Diagnosed with Depression Census Tract: 41027950400
Adults Ever Diagnosed with Depression Census Tract: 41027950400
24.1%
(2021)
Compared to:
OR Census Tracts
The distribution is based on data from 825 Oregon census tracts.
U.S. Census Tracts
The distribution is based on data from 68,167 U.S. census tracts.
Hood River, OR County Value
(23.3%)
The regional value is compared to the Hood River County value.
US Value
(19.5%)
The regional value is compared to the national value.
Adults Ever Diagnosed with Depression Census Tract: 41031940000
Adults Ever Diagnosed with Depression Census Tract: 41031940000
29.4%
(2021)
Compared to:
OR Census Tracts
The distribution is based on data from 825 Oregon census tracts.
U.S. Census Tracts
The distribution is based on data from 68,167 U.S. census tracts.
Wasco, OR County Value
(24.5%)
The regional value is compared to the Wasco County value.
Jefferson, OR County Value
(24.5%)
The regional value is compared to the Jefferson County value.
US Value
(19.5%)
The regional value is compared to the national value.
Adults Ever Diagnosed with Depression Census Tract: 41065970100
Adults Ever Diagnosed with Depression Census Tract: 41065970100
23.5%
(2021)
Compared to:
OR Census Tracts
The distribution is based on data from 825 Oregon census tracts.
U.S. Census Tracts
The distribution is based on data from 68,167 U.S. census tracts.
Wasco, OR County Value
(24.5%)
The regional value is compared to the Wasco County value.
US Value
(19.5%)
The regional value is compared to the national value.
Adults Ever Diagnosed with Depression Census Tract: 41065970200
Adults Ever Diagnosed with Depression Census Tract: 41065970200
26.3%
(2021)
Compared to:
OR Census Tracts
The distribution is based on data from 825 Oregon census tracts.
U.S. Census Tracts
The distribution is based on data from 68,167 U.S. census tracts.
Wasco, OR County Value
(24.5%)
The regional value is compared to the Wasco County value.
US Value
(19.5%)
The regional value is compared to the national value.
Adults Ever Diagnosed with Depression Census Tract: 41065970300
Adults Ever Diagnosed with Depression Census Tract: 41065970300
24.7%
(2021)
Compared to:
OR Census Tracts
The distribution is based on data from 825 Oregon census tracts.
U.S. Census Tracts
The distribution is based on data from 68,167 U.S. census tracts.
Wasco, OR County Value
(24.5%)
The regional value is compared to the Wasco County value.
US Value
(19.5%)
The regional value is compared to the national value.
Adults Ever Diagnosed with Depression Census Tract: 41065970400
Adults Ever Diagnosed with Depression Census Tract: 41065970400
24.8%
(2021)
Compared to:
OR Census Tracts
The distribution is based on data from 825 Oregon census tracts.
U.S. Census Tracts
The distribution is based on data from 68,167 U.S. census tracts.
Wasco, OR County Value
(24.5%)
The regional value is compared to the Wasco County value.
US Value
(19.5%)
The regional value is compared to the national value.
Adults Ever Diagnosed with Depression Census Tract: 41065970500
Adults Ever Diagnosed with Depression Census Tract: 41065970500
26.9%
(2021)
Compared to:
OR Census Tracts
The distribution is based on data from 825 Oregon census tracts.
U.S. Census Tracts
The distribution is based on data from 68,167 U.S. census tracts.
Wasco, OR County Value
(24.5%)
The regional value is compared to the Wasco County value.
US Value
(19.5%)
The regional value is compared to the national value.
Adults Ever Diagnosed with Depression Census Tract: 41065970600
Adults Ever Diagnosed with Depression Census Tract: 41065970600
25.0%
(2021)
Compared to:
OR Census Tracts
The distribution is based on data from 825 Oregon census tracts.
U.S. Census Tracts
The distribution is based on data from 68,167 U.S. census tracts.
Wasco, OR County Value
(24.5%)
The regional value is compared to the Wasco County value.
US Value
(19.5%)
The regional value is compared to the national value.
Adults Ever Diagnosed with Depression Census Tract: 41065970700
Adults Ever Diagnosed with Depression Census Tract: 41065970700
24.9%
(2021)
Compared to:
OR Census Tracts
The distribution is based on data from 825 Oregon census tracts.
U.S. Census Tracts
The distribution is based on data from 68,167 U.S. census tracts.
Wasco, OR County Value
(24.5%)
The regional value is compared to the Wasco County value.
US Value
(19.5%)
The regional value is compared to the national value.
Adults Ever Diagnosed with Depression Census Tract: 41065970800
Adults Ever Diagnosed with Depression Census Tract: 41065970800
24.7%
(2021)
Compared to:
OR Census Tracts
The distribution is based on data from 825 Oregon census tracts.
U.S. Census Tracts
The distribution is based on data from 68,167 U.S. census tracts.
Wasco, OR County Value
(24.5%)
The regional value is compared to the Wasco County value.
US Value
(19.5%)
The regional value is compared to the national value.
Health / Mental Health & Mental Disorders
Age-Adjusted Death Rate due to Alzheimer's Disease
Value
Compared to:
Age-Adjusted Death Rate due to Alzheimer's Disease State: Oregon
Age-Adjusted Death Rate due to Alzheimer's Disease State: Oregon
34.1
Deaths per 100,000 population
(2015-2017)
Compared to:


US Value
(30.3)
The regional value is compared to the national value. The source for the national value is Centers for Disease Control and Prevention
Prior Value
(31.8)
Prior Value compares a measured value with the previously measured value. Confidence intervals were not taken into account in determining the direction of the comparison.
Trend
This comparison measures the indicator’s values over multiple time periods.<br>The Mann-Kendall Test for Statistical Significance is used to evaluate the trend<br>over 4 to 10 periods of measure, subject to data availability and comparability.
Age-Adjusted Death Rate due to Suicide State: Oregon
Age-Adjusted Death Rate due to Suicide State: Oregon
18.2
Deaths per 100,000 population
(2015-2017)
Compared to:

US Value
(13.6)
The regional value is compared to the national value. The source for the national value is Centers for Disease Control and Prevention
Prior Value
(18.1)
Prior Value compares a measured value with the previously measured value. Confidence intervals were not taken into account in determining the direction of the comparison.
Trend
This comparison measures the indicator’s values over multiple time periods.<br>The Mann-Kendall Test for Statistical Significance is used to evaluate the trend<br>over 4 to 10 periods of measure, subject to data availability and comparability.
HP 2030 Target
(12.8)
<div>MHMD-01: Reduce the suicide rate <strong>(LEADING HEALTH INDICATOR)</strong></div>
Health / Mental Health & Mental Disorders
Alzheimer's Disease or Dementia: Medicare Population
Value
Compared to:
Alzheimer's Disease or Dementia: Medicare Population County: Hood River
Alzheimer's Disease or Dementia: Medicare Population County: Hood River
6.0%
(2022)
Compared to:
OR Counties
The distribution is based on data from 36 Oregon counties.
U.S. Counties
The distribution is based on data from 3,129 U.S. counties and county equivalents.
OR Value
(5.0%)
The regional value is compared to the Oregon State value.
US Value
(6.0%)
The regional value is compared to the national value.
Prior Value
(5.0%)
Prior Value compares a measured value with the previously measured value. Confidence intervals were not taken into account in determining the direction of the comparison.
Trend
This comparison measures the indicator’s values over multiple time periods.<br>The Mann-Kendall Test for Statistical Significance is used to evaluate the trend<br>over 4 to 10 periods of measure, subject to data availability and comparability.
Alzheimer's Disease or Dementia: Medicare Population County: Wasco
Alzheimer's Disease or Dementia: Medicare Population County: Wasco
6.0%
(2022)
Compared to:
OR Counties
The distribution is based on data from 36 Oregon counties.
U.S. Counties
The distribution is based on data from 3,129 U.S. counties and county equivalents.
OR Value
(5.0%)
The regional value is compared to the Oregon State value.
US Value
(6.0%)
The regional value is compared to the national value.
Prior Value
(6.0%)
Prior Value compares a measured value with the previously measured value. Confidence intervals were not taken into account in determining the direction of the comparison.
Trend
This comparison measures the indicator’s values over multiple time periods.<br>The Mann-Kendall Test for Statistical Significance is used to evaluate the trend<br>over 4 to 10 periods of measure, subject to data availability and comparability.
Alzheimer's Disease or Dementia: Medicare Population State: Oregon
Alzheimer's Disease or Dementia: Medicare Population State: Oregon
5.0%
(2022)
Compared to:
U.S. States
The distribution is based on data from 50 U.S. states and the District of Columbia.
US Value
(6.0%)
The regional value is compared to the national value.
Prior Value
(5.0%)
Prior Value compares a measured value with the previously measured value. Confidence intervals were not taken into account in determining the direction of the comparison.
Trend
This comparison measures the indicator’s values over multiple time periods.<br>The Mann-Kendall Test for Statistical Significance is used to evaluate the trend<br>over 4 to 10 periods of measure, subject to data availability and comparability.
Death Rate due to Suicide County: Hood River
Death Rate due to Suicide County: Hood River
20.9
Deaths per 100,000 population
(2021)
Compared to:
OR Counties
The distribution is based on data from 36 Oregon counties.
OR Value
(20.9)
The regional value is compared to the Oregon State value.
Prior Value
(23.9)
Prior Value compares a measured value with the previously measured value. Confidence intervals were not taken into account in determining the direction of the comparison.
Death Rate due to Suicide County: Wasco
Death Rate due to Suicide County: Wasco
26.3
Deaths per 100,000 population
(2021)
Compared to:
OR Counties
The distribution is based on data from 36 Oregon counties.
OR Value
(20.9)
The regional value is compared to the Oregon State value.
Prior Value
(29.3)
Prior Value compares a measured value with the previously measured value. Confidence intervals were not taken into account in determining the direction of the comparison.
Death Rate due to Suicide State: Oregon
Death Rate due to Suicide State: Oregon
20.9
Deaths per 100,000 population
(2021)
Compared to:
Prior Value
(19.6)
Prior Value compares a measured value with the previously measured value. Confidence intervals were not taken into account in determining the direction of the comparison.
Trend
This comparison measures the indicator’s values over multiple time periods.<br>The Mann-Kendall Test for Statistical Significance is used to evaluate the trend<br>over 4 to 10 periods of measure, subject to data availability and comparability.
Depression: Medicare Population County: Hood River
Depression: Medicare Population County: Hood River
13.0%
(2022)
Compared to:
OR Counties
The distribution is based on data from 36 Oregon counties.
U.S. Counties
The distribution is based on data from 3,129 U.S. counties and county equivalents.
OR Value
(16.0%)
The regional value is compared to the Oregon State value.
US Value
(16.0%)
The regional value is compared to the national value.
Prior Value
(12.0%)
Prior Value compares a measured value with the previously measured value. Confidence intervals were not taken into account in determining the direction of the comparison.
Trend
This comparison measures the indicator’s values over multiple time periods.<br>The Mann-Kendall Test for Statistical Significance is used to evaluate the trend<br>over 4 to 10 periods of measure, subject to data availability and comparability.
Depression: Medicare Population County: Wasco
Depression: Medicare Population County: Wasco
13.0%
(2022)
Compared to:
OR Counties
The distribution is based on data from 36 Oregon counties.
U.S. Counties
The distribution is based on data from 3,129 U.S. counties and county equivalents.
OR Value
(16.0%)
The regional value is compared to the Oregon State value.
US Value
(16.0%)
The regional value is compared to the national value.
Prior Value
(14.0%)
Prior Value compares a measured value with the previously measured value. Confidence intervals were not taken into account in determining the direction of the comparison.
Trend
This comparison measures the indicator’s values over multiple time periods.<br>The Mann-Kendall Test for Statistical Significance is used to evaluate the trend<br>over 4 to 10 periods of measure, subject to data availability and comparability.
Depression: Medicare Population State: Oregon
Depression: Medicare Population State: Oregon
16.0%
(2022)
Compared to:
U.S. States
The distribution is based on data from 50 U.S. states and the District of Columbia.
US Value
(16.0%)
The regional value is compared to the national value.
Prior Value
(16.0%)
Prior Value compares a measured value with the previously measured value. Confidence intervals were not taken into account in determining the direction of the comparison.
Trend
This comparison measures the indicator’s values over multiple time periods.<br>The Mann-Kendall Test for Statistical Significance is used to evaluate the trend<br>over 4 to 10 periods of measure, subject to data availability and comparability.
Mental Health Provider Rate County: Hood River
Mental Health Provider Rate County: Hood River
433
Providers per 100,000 population
(2023)
Compared to:

OR Counties
The distribution is based on data from 35 Oregon counties.
U.S. Counties
The distribution is based on data from 2,956 U.S. counties and county equivalents.
OR Value
(677)
The regional value is compared to the Oregon State value.
Prior Value
(412)
Prior Value compares a measured value with the previously measured value. Confidence intervals were not taken into account in determining the direction of the comparison.
Trend
This comparison measures the indicator’s values over multiple time periods.<br>The Mann-Kendall Test for Statistical Significance is used to evaluate the trend<br>over 4 to 10 periods of measure, subject to data availability and comparability.
Mental Health Provider Rate County: Wasco
Mental Health Provider Rate County: Wasco
651
Providers per 100,000 population
(2023)
Compared to:
OR Counties
The distribution is based on data from 35 Oregon counties.
U.S. Counties
The distribution is based on data from 2,956 U.S. counties and county equivalents.
OR Value
(677)
The regional value is compared to the Oregon State value.
Prior Value
(602)
Prior Value compares a measured value with the previously measured value. Confidence intervals were not taken into account in determining the direction of the comparison.
Trend
This comparison measures the indicator’s values over multiple time periods.<br>The Mann-Kendall Test for Statistical Significance is used to evaluate the trend<br>over 4 to 10 periods of measure, subject to data availability and comparability.
Mental Health Provider Rate State: Oregon
Mental Health Provider Rate State: Oregon
677
Providers per 100,000 population
(2023)
Compared to:
U.S. States
The distribution is based on data from 50 U.S. states and the District of Columbia.
Prior Value
(632)
Prior Value compares a measured value with the previously measured value. Confidence intervals were not taken into account in determining the direction of the comparison.
Trend
This comparison measures the indicator’s values over multiple time periods.<br>The Mann-Kendall Test for Statistical Significance is used to evaluate the trend<br>over 4 to 10 periods of measure, subject to data availability and comparability.
Persons with a Cognitive Difficulty County: Hood River
Persons with a Cognitive Difficulty County: Hood River
5.0%
(2018-2022)
Compared to:

OR Value
(6.7%)
The regional value is compared to the Oregon State value.
US Value
(5.3%)
The regional value is compared to the national value.
Trend
This comparison measures the indicator’s values over multiple time periods.<br>The Mann-Kendall Test for Statistical Significance is used to evaluate the trend<br>over 4 to 10 periods of measure, subject to data availability and comparability.
Persons with a Cognitive Difficulty County: Wasco
Persons with a Cognitive Difficulty County: Wasco
8.6%
(2018-2022)
Compared to:


OR Value
(6.7%)
The regional value is compared to the Oregon State value.
US Value
(5.3%)
The regional value is compared to the national value.
Trend
This comparison measures the indicator’s values over multiple time periods.<br>The Mann-Kendall Test for Statistical Significance is used to evaluate the trend<br>over 4 to 10 periods of measure, subject to data availability and comparability.
Persons with a Cognitive Difficulty State: Oregon
Persons with a Cognitive Difficulty State: Oregon
6.7%
(2018-2022)
Compared to:

US Value
(5.3%)
The regional value is compared to the national value.
Trend
This comparison measures the indicator’s values over multiple time periods.<br>The Mann-Kendall Test for Statistical Significance is used to evaluate the trend<br>over 4 to 10 periods of measure, subject to data availability and comparability.
Persons with a Cognitive Difficulty Census Place: Antelope
Persons with a Cognitive Difficulty Census Place: Antelope
11.6%
(2018-2022)
Compared to:
Wasco, OR County Value
(8.6%)
The regional value is compared to the Wasco County value.
OR Value
(6.7%)
The regional value is compared to the Oregon State value.
US Value
(5.3%)
The regional value is compared to the national value.
Trend
This comparison measures the indicator’s values over multiple time periods.<br>The Mann-Kendall Test for Statistical Significance is used to evaluate the trend<br>over 4 to 10 periods of measure, subject to data availability and comparability.
Persons with a Cognitive Difficulty Census Place: Cascade Locks
Persons with a Cognitive Difficulty Census Place: Cascade Locks
10.9%
(2018-2022)
Compared to:
Hood River, OR County Value
(5.0%)
The regional value is compared to the Hood River County value.
OR Value
(6.7%)
The regional value is compared to the Oregon State value.
US Value
(5.3%)
The regional value is compared to the national value.
Trend
This comparison measures the indicator’s values over multiple time periods.<br>The Mann-Kendall Test for Statistical Significance is used to evaluate the trend<br>over 4 to 10 periods of measure, subject to data availability and comparability.
Persons with a Cognitive Difficulty Census Place: Chenoweth
Persons with a Cognitive Difficulty Census Place: Chenoweth
9.0%
(2018-2022)
Compared to:
Wasco, OR County Value
(8.6%)
The regional value is compared to the Wasco County value.
OR Value
(6.7%)
The regional value is compared to the Oregon State value.
US Value
(5.3%)
The regional value is compared to the national value.
Trend
This comparison measures the indicator’s values over multiple time periods.<br>The Mann-Kendall Test for Statistical Significance is used to evaluate the trend<br>over 4 to 10 periods of measure, subject to data availability and comparability.
Persons with a Cognitive Difficulty Census Place: Dufur
Persons with a Cognitive Difficulty Census Place: Dufur
9.0%
(2018-2022)
Compared to:
Wasco, OR County Value
(8.6%)
The regional value is compared to the Wasco County value.
OR Value
(6.7%)
The regional value is compared to the Oregon State value.
US Value
(5.3%)
The regional value is compared to the national value.
Trend
This comparison measures the indicator’s values over multiple time periods.<br>The Mann-Kendall Test for Statistical Significance is used to evaluate the trend<br>over 4 to 10 periods of measure, subject to data availability and comparability.
Persons with a Cognitive Difficulty Census Place: Hood River
Persons with a Cognitive Difficulty Census Place: Hood River
6.6%
(2018-2022)
Compared to:
Hood River, OR County Value
(5.0%)
The regional value is compared to the Hood River County value.
OR Value
(6.7%)
The regional value is compared to the Oregon State value.
US Value
(5.3%)
The regional value is compared to the national value.
Trend
This comparison measures the indicator’s values over multiple time periods.<br>The Mann-Kendall Test for Statistical Significance is used to evaluate the trend<br>over 4 to 10 periods of measure, subject to data availability and comparability.
Persons with a Cognitive Difficulty Census Place: Maupin
Persons with a Cognitive Difficulty Census Place: Maupin
7.9%
(2018-2022)
Compared to:
Wasco, OR County Value
(8.6%)
The regional value is compared to the Wasco County value.
OR Value
(6.7%)
The regional value is compared to the Oregon State value.
US Value
(5.3%)
The regional value is compared to the national value.
Trend
This comparison measures the indicator’s values over multiple time periods.<br>The Mann-Kendall Test for Statistical Significance is used to evaluate the trend<br>over 4 to 10 periods of measure, subject to data availability and comparability.
Persons with a Cognitive Difficulty Census Place: Mosier
Persons with a Cognitive Difficulty Census Place: Mosier
3.3%
(2018-2022)
Compared to:

Wasco, OR County Value
(8.6%)
The regional value is compared to the Wasco County value.
OR Value
(6.7%)
The regional value is compared to the Oregon State value.
US Value
(5.3%)
The regional value is compared to the national value.
Trend
This comparison measures the indicator’s values over multiple time periods.<br>The Mann-Kendall Test for Statistical Significance is used to evaluate the trend<br>over 4 to 10 periods of measure, subject to data availability and comparability.
Persons with a Cognitive Difficulty Census Place: Mount Hood
Persons with a Cognitive Difficulty Census Place: Mount Hood
0.0%
(2018-2022)
Compared to:
Hood River, OR County Value
(5.0%)
The regional value is compared to the Hood River County value.
OR Value
(6.7%)
The regional value is compared to the Oregon State value.
US Value
(5.3%)
The regional value is compared to the national value.
Trend
This comparison measures the indicator’s values over multiple time periods.<br>The Mann-Kendall Test for Statistical Significance is used to evaluate the trend<br>over 4 to 10 periods of measure, subject to data availability and comparability.
Persons with a Cognitive Difficulty Census Place: Odell
Persons with a Cognitive Difficulty Census Place: Odell
6.4%
(2018-2022)
Compared to:
Hood River, OR County Value
(5.0%)
The regional value is compared to the Hood River County value.
OR Value
(6.7%)
The regional value is compared to the Oregon State value.
US Value
(5.3%)
The regional value is compared to the national value.
Trend
This comparison measures the indicator’s values over multiple time periods.<br>The Mann-Kendall Test for Statistical Significance is used to evaluate the trend<br>over 4 to 10 periods of measure, subject to data availability and comparability.
Persons with a Cognitive Difficulty Census Place: Parkdale
Persons with a Cognitive Difficulty Census Place: Parkdale
0.0%
(2018-2022)
Compared to:
Hood River, OR County Value
(5.0%)
The regional value is compared to the Hood River County value.
OR Value
(6.7%)
The regional value is compared to the Oregon State value.
US Value
(5.3%)
The regional value is compared to the national value.
Trend
This comparison measures the indicator’s values over multiple time periods.<br>The Mann-Kendall Test for Statistical Significance is used to evaluate the trend<br>over 4 to 10 periods of measure, subject to data availability and comparability.
Persons with a Cognitive Difficulty Census Place: Pine Grove
Persons with a Cognitive Difficulty Census Place: Pine Grove
12.0%
(2018-2022)
Compared to:
Wasco, OR County Value
(8.6%)
The regional value is compared to the Wasco County value.
OR Value
(6.7%)
The regional value is compared to the Oregon State value.
US Value
(5.3%)
The regional value is compared to the national value.
Trend
This comparison measures the indicator’s values over multiple time periods.<br>The Mann-Kendall Test for Statistical Significance is used to evaluate the trend<br>over 4 to 10 periods of measure, subject to data availability and comparability.
Persons with a Cognitive Difficulty Census Place: Pine Hollow
Persons with a Cognitive Difficulty Census Place: Pine Hollow
2.1%
(2018-2022)
Compared to:
Wasco, OR County Value
(8.6%)
The regional value is compared to the Wasco County value.
OR Value
(6.7%)
The regional value is compared to the Oregon State value.
US Value
(5.3%)
The regional value is compared to the national value.
Trend
This comparison measures the indicator’s values over multiple time periods.<br>The Mann-Kendall Test for Statistical Significance is used to evaluate the trend<br>over 4 to 10 periods of measure, subject to data availability and comparability.
Persons with a Cognitive Difficulty Census Place: Rowena
Persons with a Cognitive Difficulty Census Place: Rowena
0.0%
(2018-2022)
Compared to:
Wasco, OR County Value
(8.6%)
The regional value is compared to the Wasco County value.
OR Value
(6.7%)
The regional value is compared to the Oregon State value.
US Value
(5.3%)
The regional value is compared to the national value.
Trend
This comparison measures the indicator’s values over multiple time periods.<br>The Mann-Kendall Test for Statistical Significance is used to evaluate the trend<br>over 4 to 10 periods of measure, subject to data availability and comparability.
Persons with a Cognitive Difficulty Census Place: Shaniko
Persons with a Cognitive Difficulty Census Place: Shaniko
16.7%
(2018-2022)
Compared to:
Wasco, OR County Value
(8.6%)
The regional value is compared to the Wasco County value.
OR Value
(6.7%)
The regional value is compared to the Oregon State value.
US Value
(5.3%)
The regional value is compared to the national value.
Trend
This comparison measures the indicator’s values over multiple time periods.<br>The Mann-Kendall Test for Statistical Significance is used to evaluate the trend<br>over 4 to 10 periods of measure, subject to data availability and comparability.
Persons with a Cognitive Difficulty Census Place: Sportsmans Park
Persons with a Cognitive Difficulty Census Place: Sportsmans Park
7.5%
(2018-2022)
Compared to:
Wasco, OR County Value
(8.6%)
The regional value is compared to the Wasco County value.
OR Value
(6.7%)
The regional value is compared to the Oregon State value.
US Value
(5.3%)
The regional value is compared to the national value.
Persons with a Cognitive Difficulty Census Place: The Dalles
Persons with a Cognitive Difficulty Census Place: The Dalles
9.3%
(2018-2022)
Compared to:
Wasco, OR County Value
(8.6%)
The regional value is compared to the Wasco County value.
OR Value
(6.7%)
The regional value is compared to the Oregon State value.
US Value
(5.3%)
The regional value is compared to the national value.
Trend
This comparison measures the indicator’s values over multiple time periods.<br>The Mann-Kendall Test for Statistical Significance is used to evaluate the trend<br>over 4 to 10 periods of measure, subject to data availability and comparability.
Persons with a Cognitive Difficulty Census Place: Tygh Valley
Persons with a Cognitive Difficulty Census Place: Tygh Valley
0.0%
(2018-2022)
Compared to:
Wasco, OR County Value
(8.6%)
The regional value is compared to the Wasco County value.
OR Value
(6.7%)
The regional value is compared to the Oregon State value.
US Value
(5.3%)
The regional value is compared to the national value.
Trend
This comparison measures the indicator’s values over multiple time periods.<br>The Mann-Kendall Test for Statistical Significance is used to evaluate the trend<br>over 4 to 10 periods of measure, subject to data availability and comparability.
Persons with a Cognitive Difficulty Census Place: Wamic
Persons with a Cognitive Difficulty Census Place: Wamic
0.0%
(2018-2022)
Compared to:
Wasco, OR County Value
(8.6%)
The regional value is compared to the Wasco County value.
OR Value
(6.7%)
The regional value is compared to the Oregon State value.
US Value
(5.3%)
The regional value is compared to the national value.
Trend
This comparison measures the indicator’s values over multiple time periods.<br>The Mann-Kendall Test for Statistical Significance is used to evaluate the trend<br>over 4 to 10 periods of measure, subject to data availability and comparability.
Persons with a Cognitive Difficulty Zip Code: 97001
Persons with a Cognitive Difficulty Zip Code: 97001
29.4%
(2018-2022)
Compared to:
Wasco, OR County Value
(8.6%)
The regional value is compared to the Wasco County value.
Trend
This comparison measures the indicator’s values over multiple time periods.<br>The Mann-Kendall Test for Statistical Significance is used to evaluate the trend<br>over 4 to 10 periods of measure, subject to data availability and comparability.
Persons with a Cognitive Difficulty Zip Code: 97014
Persons with a Cognitive Difficulty Zip Code: 97014
10.3%
(2018-2022)
Compared to:
Hood River, OR County Value
(5.0%)
The regional value is compared to the Hood River County value.
Trend
This comparison measures the indicator’s values over multiple time periods.<br>The Mann-Kendall Test for Statistical Significance is used to evaluate the trend<br>over 4 to 10 periods of measure, subject to data availability and comparability.
Persons with a Cognitive Difficulty Zip Code: 97021
Persons with a Cognitive Difficulty Zip Code: 97021
9.6%
(2018-2022)
Compared to:
Wasco, OR County Value
(8.6%)
The regional value is compared to the Wasco County value.
Trend
This comparison measures the indicator’s values over multiple time periods.<br>The Mann-Kendall Test for Statistical Significance is used to evaluate the trend<br>over 4 to 10 periods of measure, subject to data availability and comparability.
Persons with a Cognitive Difficulty Zip Code: 97031
Persons with a Cognitive Difficulty Zip Code: 97031
4.7%
(2018-2022)
Compared to:
Hood River, OR County Value
(5.0%)
The regional value is compared to the Hood River County value.
Trend
This comparison measures the indicator’s values over multiple time periods.<br>The Mann-Kendall Test for Statistical Significance is used to evaluate the trend<br>over 4 to 10 periods of measure, subject to data availability and comparability.
Persons with a Cognitive Difficulty Zip Code: 97037
Persons with a Cognitive Difficulty Zip Code: 97037
9.2%
(2018-2022)
Compared to:
Wasco, OR County Value
(8.6%)
The regional value is compared to the Wasco County value.
Trend
This comparison measures the indicator’s values over multiple time periods.<br>The Mann-Kendall Test for Statistical Significance is used to evaluate the trend<br>over 4 to 10 periods of measure, subject to data availability and comparability.
Persons with a Cognitive Difficulty Zip Code: 97040
Persons with a Cognitive Difficulty Zip Code: 97040
2.3%
(2018-2022)
Compared to:
Wasco, OR County Value
(8.6%)
The regional value is compared to the Wasco County value.
Trend
This comparison measures the indicator’s values over multiple time periods.<br>The Mann-Kendall Test for Statistical Significance is used to evaluate the trend<br>over 4 to 10 periods of measure, subject to data availability and comparability.
Persons with a Cognitive Difficulty Zip Code: 97041
Persons with a Cognitive Difficulty Zip Code: 97041
4.0%
(2018-2022)
Compared to:
Hood River, OR County Value
(5.0%)
The regional value is compared to the Hood River County value.
Trend
This comparison measures the indicator’s values over multiple time periods.<br>The Mann-Kendall Test for Statistical Significance is used to evaluate the trend<br>over 4 to 10 periods of measure, subject to data availability and comparability.
Persons with a Cognitive Difficulty Zip Code: 97057
Persons with a Cognitive Difficulty Zip Code: 97057
16.7%
(2018-2022)
Compared to:
Wasco, OR County Value
(8.6%)
The regional value is compared to the Wasco County value.
Trend
This comparison measures the indicator’s values over multiple time periods.<br>The Mann-Kendall Test for Statistical Significance is used to evaluate the trend<br>over 4 to 10 periods of measure, subject to data availability and comparability.
Persons with a Cognitive Difficulty Zip Code: 97058
Persons with a Cognitive Difficulty Zip Code: 97058
8.9%
(2018-2022)
Compared to:
Wasco, OR County Value
(8.6%)
The regional value is compared to the Wasco County value.
Trend
This comparison measures the indicator’s values over multiple time periods.<br>The Mann-Kendall Test for Statistical Significance is used to evaluate the trend<br>over 4 to 10 periods of measure, subject to data availability and comparability.
Persons with a Cognitive Difficulty Zip Code: 97063
Persons with a Cognitive Difficulty Zip Code: 97063
1.8%
(2018-2022)
Compared to:
Wasco, OR County Value
(8.6%)
The regional value is compared to the Wasco County value.
Trend
This comparison measures the indicator’s values over multiple time periods.<br>The Mann-Kendall Test for Statistical Significance is used to evaluate the trend<br>over 4 to 10 periods of measure, subject to data availability and comparability.
Persons with a Cognitive Difficulty Zip Code: 97761
Persons with a Cognitive Difficulty Zip Code: 97761
9.4%
(2018-2022)
Compared to:
Wasco, OR County Value
(8.6%)
The regional value is compared to the Wasco County value.
Jefferson, OR County Value
(8.2%)
The regional value is compared to the Jefferson County value.
Trend
This comparison measures the indicator’s values over multiple time periods.<br>The Mann-Kendall Test for Statistical Significance is used to evaluate the trend<br>over 4 to 10 periods of measure, subject to data availability and comparability.
Persons with a Cognitive Difficulty Census Tract: 41027950100
Persons with a Cognitive Difficulty Census Tract: 41027950100
5.5%
(2018-2022)
Compared to:
Hood River, OR County Value
(5.0%)
The regional value is compared to the Hood River County value.
Trend
This comparison measures the indicator’s values over multiple time periods.<br>The Mann-Kendall Test for Statistical Significance is used to evaluate the trend<br>over 4 to 10 periods of measure, subject to data availability and comparability.
Persons with a Cognitive Difficulty Census Tract: 41027950200
Persons with a Cognitive Difficulty Census Tract: 41027950200
2.5%
(2015-2019)
Compared to:
Hood River, OR County Value
(4.3%)
The regional value is compared to the Hood River County value.
Persons with a Cognitive Difficulty Census Tract: 41027950201
Persons with a Cognitive Difficulty Census Tract: 41027950201
2.1%
(2018-2022)
Compared to:
Hood River, OR County Value
(5.0%)
The regional value is compared to the Hood River County value.
Persons with a Cognitive Difficulty Census Tract: 41027950202
Persons with a Cognitive Difficulty Census Tract: 41027950202
3.4%
(2018-2022)
Compared to:
Hood River, OR County Value
(5.0%)
The regional value is compared to the Hood River County value.
Persons with a Cognitive Difficulty Census Tract: 41027950300
Persons with a Cognitive Difficulty Census Tract: 41027950300
4.6%
(2015-2019)
Compared to:
Hood River, OR County Value
(4.3%)
The regional value is compared to the Hood River County value.
Persons with a Cognitive Difficulty Census Tract: 41027950301
Persons with a Cognitive Difficulty Census Tract: 41027950301
7.3%
(2018-2022)
Compared to:
Hood River, OR County Value
(5.0%)
The regional value is compared to the Hood River County value.
Persons with a Cognitive Difficulty Census Tract: 41027950302
Persons with a Cognitive Difficulty Census Tract: 41027950302
7.0%
(2018-2022)
Compared to:
Hood River, OR County Value
(5.0%)
The regional value is compared to the Hood River County value.
Persons with a Cognitive Difficulty Census Tract: 41027950400
Persons with a Cognitive Difficulty Census Tract: 41027950400
5.2%
(2018-2022)
Compared to:
Hood River, OR County Value
(5.0%)
The regional value is compared to the Hood River County value.
Trend
This comparison measures the indicator’s values over multiple time periods.<br>The Mann-Kendall Test for Statistical Significance is used to evaluate the trend<br>over 4 to 10 periods of measure, subject to data availability and comparability.
Persons with a Cognitive Difficulty Census Tract: 41031940000
Persons with a Cognitive Difficulty Census Tract: 41031940000
9.4%
(2018-2022)
Compared to:
Jefferson, OR County Value
(8.2%)
The regional value is compared to the Jefferson County value.
Wasco, OR County Value
(8.6%)
The regional value is compared to the Wasco County value.
Trend
This comparison measures the indicator’s values over multiple time periods.<br>The Mann-Kendall Test for Statistical Significance is used to evaluate the trend<br>over 4 to 10 periods of measure, subject to data availability and comparability.
Persons with a Cognitive Difficulty Census Tract: 41065970100
Persons with a Cognitive Difficulty Census Tract: 41065970100
10.3%
(2018-2022)
Compared to:
Wasco, OR County Value
(8.6%)
The regional value is compared to the Wasco County value.
Trend
This comparison measures the indicator’s values over multiple time periods.<br>The Mann-Kendall Test for Statistical Significance is used to evaluate the trend<br>over 4 to 10 periods of measure, subject to data availability and comparability.
Persons with a Cognitive Difficulty Census Tract: 41065970200
Persons with a Cognitive Difficulty Census Tract: 41065970200
6.4%
(2018-2022)
Compared to:
Wasco, OR County Value
(8.6%)
The regional value is compared to the Wasco County value.
Trend
This comparison measures the indicator’s values over multiple time periods.<br>The Mann-Kendall Test for Statistical Significance is used to evaluate the trend<br>over 4 to 10 periods of measure, subject to data availability and comparability.
Persons with a Cognitive Difficulty Census Tract: 41065970300
Persons with a Cognitive Difficulty Census Tract: 41065970300
5.1%
(2018-2022)
Compared to:
Wasco, OR County Value
(8.6%)
The regional value is compared to the Wasco County value.
Trend
This comparison measures the indicator’s values over multiple time periods.<br>The Mann-Kendall Test for Statistical Significance is used to evaluate the trend<br>over 4 to 10 periods of measure, subject to data availability and comparability.
Persons with a Cognitive Difficulty Census Tract: 41065970400
Persons with a Cognitive Difficulty Census Tract: 41065970400
10.1%
(2018-2022)
Compared to:
Wasco, OR County Value
(8.6%)
The regional value is compared to the Wasco County value.
Trend
This comparison measures the indicator’s values over multiple time periods.<br>The Mann-Kendall Test for Statistical Significance is used to evaluate the trend<br>over 4 to 10 periods of measure, subject to data availability and comparability.
Persons with a Cognitive Difficulty Census Tract: 41065970500
Persons with a Cognitive Difficulty Census Tract: 41065970500
14.4%
(2018-2022)
Compared to:
Wasco, OR County Value
(8.6%)
The regional value is compared to the Wasco County value.
Trend
This comparison measures the indicator’s values over multiple time periods.<br>The Mann-Kendall Test for Statistical Significance is used to evaluate the trend<br>over 4 to 10 periods of measure, subject to data availability and comparability.
Persons with a Cognitive Difficulty Census Tract: 41065970600
Persons with a Cognitive Difficulty Census Tract: 41065970600
6.9%
(2018-2022)
Compared to:
Wasco, OR County Value
(8.6%)
The regional value is compared to the Wasco County value.
Trend
This comparison measures the indicator’s values over multiple time periods.<br>The Mann-Kendall Test for Statistical Significance is used to evaluate the trend<br>over 4 to 10 periods of measure, subject to data availability and comparability.
Persons with a Cognitive Difficulty Census Tract: 41065970700
Persons with a Cognitive Difficulty Census Tract: 41065970700
2.8%
(2018-2022)
Compared to:
Wasco, OR County Value
(8.6%)
The regional value is compared to the Wasco County value.
Trend
This comparison measures the indicator’s values over multiple time periods.<br>The Mann-Kendall Test for Statistical Significance is used to evaluate the trend<br>over 4 to 10 periods of measure, subject to data availability and comparability.
Persons with a Cognitive Difficulty Census Tract: 41065970800
Persons with a Cognitive Difficulty Census Tract: 41065970800
9.3%
(2018-2022)
Compared to:
Wasco, OR County Value
(8.6%)
The regional value is compared to the Wasco County value.
Trend
This comparison measures the indicator’s values over multiple time periods.<br>The Mann-Kendall Test for Statistical Significance is used to evaluate the trend<br>over 4 to 10 periods of measure, subject to data availability and comparability.
Poor Mental Health: 14+ Days County: Hood River
Poor Mental Health: 14+ Days County: Hood River
15.3%
(2021)
Compared to:
OR Counties
The distribution is based on data from 36 Oregon counties.
U.S. Counties
The distribution is based on data from 3,074 U.S. counties and county equivalents.
US Value
(14.7%)
The regional value is compared to the national value.
Poor Mental Health: 14+ Days County: Wasco
Poor Mental Health: 14+ Days County: Wasco
16.6%
(2021)
Compared to:
OR Counties
The distribution is based on data from 36 Oregon counties.
U.S. Counties
The distribution is based on data from 3,074 U.S. counties and county equivalents.
US Value
(14.7%)
The regional value is compared to the national value.
Poor Mental Health: 14+ Days Census Place: Cascade Locks
Poor Mental Health: 14+ Days Census Place: Cascade Locks
19.8%
(2021)
Compared to:
OR Census Places
The distribution is based on data from 367 locales.
U.S. Census Places
The distribution is based on data from 27,528 U.S. Census Places.
Hood River, OR County Value
(15.3%)
The regional value is compared to the Hood River County value.
US Value
(14.7%)
The regional value is compared to the national value.
Poor Mental Health: 14+ Days Census Place: Chenoweth
Poor Mental Health: 14+ Days Census Place: Chenoweth
18.3%
(2021)
Compared to:
OR Census Places
The distribution is based on data from 367 locales.
U.S. Census Places
The distribution is based on data from 27,528 U.S. Census Places.
Wasco, OR County Value
(16.6%)
The regional value is compared to the Wasco County value.
US Value
(14.7%)
The regional value is compared to the national value.
Poor Mental Health: 14+ Days Census Place: Dufur
Poor Mental Health: 14+ Days Census Place: Dufur
16.8%
(2021)
Compared to:
OR Census Places
The distribution is based on data from 367 locales.
U.S. Census Places
The distribution is based on data from 27,528 U.S. Census Places.
Wasco, OR County Value
(16.6%)
The regional value is compared to the Wasco County value.
US Value
(14.7%)
The regional value is compared to the national value.
Poor Mental Health: 14+ Days Census Place: Hood River
Poor Mental Health: 14+ Days Census Place: Hood River
16.2%
(2021)
Compared to:
OR Census Places
The distribution is based on data from 367 locales.
U.S. Census Places
The distribution is based on data from 27,528 U.S. Census Places.
Hood River, OR County Value
(15.3%)
The regional value is compared to the Hood River County value.
US Value
(14.7%)
The regional value is compared to the national value.
Poor Mental Health: 14+ Days Census Place: Maupin
Poor Mental Health: 14+ Days Census Place: Maupin
14.7%
(2021)
Compared to:
OR Census Places
The distribution is based on data from 367 locales.
U.S. Census Places
The distribution is based on data from 27,528 U.S. Census Places.
Wasco, OR County Value
(16.6%)
The regional value is compared to the Wasco County value.
US Value
(14.7%)
The regional value is compared to the national value.
Poor Mental Health: 14+ Days Census Place: Mosier
Poor Mental Health: 14+ Days Census Place: Mosier
16.4%
(2021)
Compared to:
OR Census Places
The distribution is based on data from 367 locales.
U.S. Census Places
The distribution is based on data from 27,528 U.S. Census Places.
Wasco, OR County Value
(16.6%)
The regional value is compared to the Wasco County value.
US Value
(14.7%)
The regional value is compared to the national value.
Poor Mental Health: 14+ Days Census Place: Mount Hood
Poor Mental Health: 14+ Days Census Place: Mount Hood
17.9%
(2021)
Compared to:
OR Census Places
The distribution is based on data from 367 locales.
U.S. Census Places
The distribution is based on data from 27,528 U.S. Census Places.
Hood River, OR County Value
(15.3%)
The regional value is compared to the Hood River County value.
US Value
(14.7%)
The regional value is compared to the national value.
Poor Mental Health: 14+ Days Census Place: Odell
Poor Mental Health: 14+ Days Census Place: Odell
17.4%
(2021)
Compared to:
OR Census Places
The distribution is based on data from 367 locales.
U.S. Census Places
The distribution is based on data from 27,528 U.S. Census Places.
Hood River, OR County Value
(15.3%)
The regional value is compared to the Hood River County value.
US Value
(14.7%)
The regional value is compared to the national value.
Poor Mental Health: 14+ Days Census Place: Parkdale
Poor Mental Health: 14+ Days Census Place: Parkdale
19.0%
(2021)
Compared to:
OR Census Places
The distribution is based on data from 367 locales.
U.S. Census Places
The distribution is based on data from 27,528 U.S. Census Places.
Hood River, OR County Value
(15.3%)
The regional value is compared to the Hood River County value.
US Value
(14.7%)
The regional value is compared to the national value.
Poor Mental Health: 14+ Days Census Place: Pine Grove
Poor Mental Health: 14+ Days Census Place: Pine Grove
16.8%
(2021)
Compared to:
OR Census Places
The distribution is based on data from 367 locales.
U.S. Census Places
The distribution is based on data from 27,528 U.S. Census Places.
Wasco, OR County Value
(16.6%)
The regional value is compared to the Wasco County value.
US Value
(14.7%)
The regional value is compared to the national value.
Poor Mental Health: 14+ Days Census Place: Pine Hollow
Poor Mental Health: 14+ Days Census Place: Pine Hollow
14.0%
(2021)
Compared to:
OR Census Places
The distribution is based on data from 367 locales.
U.S. Census Places
The distribution is based on data from 27,528 U.S. Census Places.
Wasco, OR County Value
(16.6%)
The regional value is compared to the Wasco County value.
US Value
(14.7%)
The regional value is compared to the national value.
Poor Mental Health: 14+ Days Census Place: Rowena
Poor Mental Health: 14+ Days Census Place: Rowena
17.0%
(2021)
Compared to:
OR Census Places
The distribution is based on data from 367 locales.
U.S. Census Places
The distribution is based on data from 27,528 U.S. Census Places.
Wasco, OR County Value
(16.6%)
The regional value is compared to the Wasco County value.
US Value
(14.7%)
The regional value is compared to the national value.
Poor Mental Health: 14+ Days Census Place: The Dalles
Poor Mental Health: 14+ Days Census Place: The Dalles
17.2%
(2021)
Compared to:
OR Census Places
The distribution is based on data from 367 locales.
U.S. Census Places
The distribution is based on data from 27,528 U.S. Census Places.
Wasco, OR County Value
(16.6%)
The regional value is compared to the Wasco County value.
US Value
(14.7%)
The regional value is compared to the national value.
Poor Mental Health: 14+ Days Census Place: Tygh Valley
Poor Mental Health: 14+ Days Census Place: Tygh Valley
16.0%
(2021)
Compared to:
OR Census Places
The distribution is based on data from 367 locales.
U.S. Census Places
The distribution is based on data from 27,528 U.S. Census Places.
Wasco, OR County Value
(16.6%)
The regional value is compared to the Wasco County value.
US Value
(14.7%)
The regional value is compared to the national value.
Poor Mental Health: 14+ Days Census Place: Wamic
Poor Mental Health: 14+ Days Census Place: Wamic
15.7%
(2021)
Compared to:
OR Census Places
The distribution is based on data from 367 locales.
U.S. Census Places
The distribution is based on data from 27,528 U.S. Census Places.
Wasco, OR County Value
(16.6%)
The regional value is compared to the Wasco County value.
US Value
(14.7%)
The regional value is compared to the national value.
Poor Mental Health: 14+ Days Zip Code: 97001
Poor Mental Health: 14+ Days Zip Code: 97001
18.5%
(2021)
Compared to:
OR Zip Codes
The distribution is based on data from 408 Oregon zip codes.
U.S. Zip Codes
The distribution is based on data from 31,435 U.S. zip codes.
Wasco, OR County Value
(16.6%)
The regional value is compared to the Wasco County value.
US Value
(14.7%)
The regional value is compared to the national value.
Poor Mental Health: 14+ Days Zip Code: 97014
Poor Mental Health: 14+ Days Zip Code: 97014
19.6%
(2021)
Compared to:
OR Zip Codes
The distribution is based on data from 408 Oregon zip codes.
U.S. Zip Codes
The distribution is based on data from 31,435 U.S. zip codes.
Hood River, OR County Value
(15.3%)
The regional value is compared to the Hood River County value.
US Value
(14.7%)
The regional value is compared to the national value.
Poor Mental Health: 14+ Days Zip Code: 97021
Poor Mental Health: 14+ Days Zip Code: 97021
16.7%
(2021)
Compared to:
OR Zip Codes
The distribution is based on data from 408 Oregon zip codes.
U.S. Zip Codes
The distribution is based on data from 31,435 U.S. zip codes.
Wasco, OR County Value
(16.6%)
The regional value is compared to the Wasco County value.
US Value
(14.7%)
The regional value is compared to the national value.
Poor Mental Health: 14+ Days Zip Code: 97031
Poor Mental Health: 14+ Days Zip Code: 97031
16.1%
(2021)
Compared to:
OR Zip Codes
The distribution is based on data from 408 Oregon zip codes.
U.S. Zip Codes
The distribution is based on data from 31,435 U.S. zip codes.
Hood River, OR County Value
(15.3%)
The regional value is compared to the Hood River County value.
US Value
(14.7%)
The regional value is compared to the national value.
Poor Mental Health: 14+ Days Zip Code: 97037
Poor Mental Health: 14+ Days Zip Code: 97037
15.5%
(2021)
Compared to:
OR Zip Codes
The distribution is based on data from 408 Oregon zip codes.
U.S. Zip Codes
The distribution is based on data from 31,435 U.S. zip codes.
Wasco, OR County Value
(16.6%)
The regional value is compared to the Wasco County value.
US Value
(14.7%)
The regional value is compared to the national value.
Poor Mental Health: 14+ Days Zip Code: 97040
Poor Mental Health: 14+ Days Zip Code: 97040
16.5%
(2021)
Compared to:
OR Zip Codes
The distribution is based on data from 408 Oregon zip codes.
U.S. Zip Codes
The distribution is based on data from 31,435 U.S. zip codes.
Wasco, OR County Value
(16.6%)
The regional value is compared to the Wasco County value.
US Value
(14.7%)
The regional value is compared to the national value.
Poor Mental Health: 14+ Days Zip Code: 97041
Poor Mental Health: 14+ Days Zip Code: 97041
17.9%
(2021)
Compared to:
OR Zip Codes
The distribution is based on data from 408 Oregon zip codes.
U.S. Zip Codes
The distribution is based on data from 31,435 U.S. zip codes.
Hood River, OR County Value
(15.3%)
The regional value is compared to the Hood River County value.
US Value
(14.7%)
The regional value is compared to the national value.
Poor Mental Health: 14+ Days Zip Code: 97058
Poor Mental Health: 14+ Days Zip Code: 97058
17.2%
(2021)
Compared to:
OR Zip Codes
The distribution is based on data from 408 Oregon zip codes.
U.S. Zip Codes
The distribution is based on data from 31,435 U.S. zip codes.
Wasco, OR County Value
(16.6%)
The regional value is compared to the Wasco County value.
US Value
(14.7%)
The regional value is compared to the national value.
Poor Mental Health: 14+ Days Zip Code: 97063
Poor Mental Health: 14+ Days Zip Code: 97063
14.6%
(2021)
Compared to:
OR Zip Codes
The distribution is based on data from 408 Oregon zip codes.
U.S. Zip Codes
The distribution is based on data from 31,435 U.S. zip codes.
Wasco, OR County Value
(16.6%)
The regional value is compared to the Wasco County value.
US Value
(14.7%)
The regional value is compared to the national value.
Poor Mental Health: 14+ Days Zip Code: 97761
Poor Mental Health: 14+ Days Zip Code: 97761
25.7%
(2021)
Compared to:
OR Zip Codes
The distribution is based on data from 408 Oregon zip codes.
U.S. Zip Codes
The distribution is based on data from 31,435 U.S. zip codes.
Wasco, OR County Value
(16.6%)
The regional value is compared to the Wasco County value.
Jefferson, OR County Value
(17.1%)
The regional value is compared to the Jefferson County value.
US Value
(14.7%)
The regional value is compared to the national value.
Poor Mental Health: 14+ Days Census Tract: 41027950100
Poor Mental Health: 14+ Days Census Tract: 41027950100
18.5%
(2021)
Compared to:
OR Census Tracts
The distribution is based on data from 825 Oregon census tracts.
U.S. Census Tracts
The distribution is based on data from 68,167 U.S. census tracts.
Hood River, OR County Value
(15.3%)
The regional value is compared to the Hood River County value.
US Value
(14.7%)
The regional value is compared to the national value.
Poor Mental Health: 14+ Days Census Tract: 41027950200
Poor Mental Health: 14+ Days Census Tract: 41027950200
14.5%
(2021)
Compared to:
OR Census Tracts
The distribution is based on data from 825 Oregon census tracts.
U.S. Census Tracts
The distribution is based on data from 68,167 U.S. census tracts.
Hood River, OR County Value
(15.3%)
The regional value is compared to the Hood River County value.
US Value
(14.7%)
The regional value is compared to the national value.
Poor Mental Health: 14+ Days Census Tract: 41027950300
Poor Mental Health: 14+ Days Census Tract: 41027950300
16.5%
(2021)
Compared to:
OR Census Tracts
The distribution is based on data from 825 Oregon census tracts.
U.S. Census Tracts
The distribution is based on data from 68,167 U.S. census tracts.
Hood River, OR County Value
(15.3%)
The regional value is compared to the Hood River County value.
US Value
(14.7%)
The regional value is compared to the national value.
Poor Mental Health: 14+ Days Census Tract: 41027950400
Poor Mental Health: 14+ Days Census Tract: 41027950400
17.3%
(2021)
Compared to:
OR Census Tracts
The distribution is based on data from 825 Oregon census tracts.
U.S. Census Tracts
The distribution is based on data from 68,167 U.S. census tracts.
Hood River, OR County Value
(15.3%)
The regional value is compared to the Hood River County value.
US Value
(14.7%)
The regional value is compared to the national value.
Poor Mental Health: 14+ Days Census Tract: 41031940000
Poor Mental Health: 14+ Days Census Tract: 41031940000
27.1%
(2021)
Compared to:
OR Census Tracts
The distribution is based on data from 825 Oregon census tracts.
U.S. Census Tracts
The distribution is based on data from 68,167 U.S. census tracts.
Wasco, OR County Value
(16.6%)
The regional value is compared to the Wasco County value.
Jefferson, OR County Value
(17.1%)
The regional value is compared to the Jefferson County value.
US Value
(14.7%)
The regional value is compared to the national value.
Poor Mental Health: 14+ Days Census Tract: 41065970100
Poor Mental Health: 14+ Days Census Tract: 41065970100
15.5%
(2021)
Compared to:
OR Census Tracts
The distribution is based on data from 825 Oregon census tracts.
U.S. Census Tracts
The distribution is based on data from 68,167 U.S. census tracts.
Wasco, OR County Value
(16.6%)
The regional value is compared to the Wasco County value.
US Value
(14.7%)
The regional value is compared to the national value.
Poor Mental Health: 14+ Days Census Tract: 41065970200
Poor Mental Health: 14+ Days Census Tract: 41065970200
18.3%
(2021)
Compared to:
OR Census Tracts
The distribution is based on data from 825 Oregon census tracts.
U.S. Census Tracts
The distribution is based on data from 68,167 U.S. census tracts.
Wasco, OR County Value
(16.6%)
The regional value is compared to the Wasco County value.
US Value
(14.7%)
The regional value is compared to the national value.
Poor Mental Health: 14+ Days Census Tract: 41065970300
Poor Mental Health: 14+ Days Census Tract: 41065970300
16.3%
(2021)
Compared to:
OR Census Tracts
The distribution is based on data from 825 Oregon census tracts.
U.S. Census Tracts
The distribution is based on data from 68,167 U.S. census tracts.
Wasco, OR County Value
(16.6%)
The regional value is compared to the Wasco County value.
US Value
(14.7%)
The regional value is compared to the national value.
Poor Mental Health: 14+ Days Census Tract: 41065970400
Poor Mental Health: 14+ Days Census Tract: 41065970400
17.3%
(2021)
Compared to:
OR Census Tracts
The distribution is based on data from 825 Oregon census tracts.
U.S. Census Tracts
The distribution is based on data from 68,167 U.S. census tracts.
Wasco, OR County Value
(16.6%)
The regional value is compared to the Wasco County value.
US Value
(14.7%)
The regional value is compared to the national value.
Poor Mental Health: 14+ Days Census Tract: 41065970500
Poor Mental Health: 14+ Days Census Tract: 41065970500
19.6%
(2021)
Compared to:
OR Census Tracts
The distribution is based on data from 825 Oregon census tracts.
U.S. Census Tracts
The distribution is based on data from 68,167 U.S. census tracts.
Wasco, OR County Value
(16.6%)
The regional value is compared to the Wasco County value.
US Value
(14.7%)
The regional value is compared to the national value.
Poor Mental Health: 14+ Days Census Tract: 41065970600
Poor Mental Health: 14+ Days Census Tract: 41065970600
16.5%
(2021)
Compared to:
OR Census Tracts
The distribution is based on data from 825 Oregon census tracts.
U.S. Census Tracts
The distribution is based on data from 68,167 U.S. census tracts.
Wasco, OR County Value
(16.6%)
The regional value is compared to the Wasco County value.
US Value
(14.7%)
The regional value is compared to the national value.
Poor Mental Health: 14+ Days Census Tract: 41065970700
Poor Mental Health: 14+ Days Census Tract: 41065970700
16.5%
(2021)
Compared to:
OR Census Tracts
The distribution is based on data from 825 Oregon census tracts.
U.S. Census Tracts
The distribution is based on data from 68,167 U.S. census tracts.
Wasco, OR County Value
(16.6%)
The regional value is compared to the Wasco County value.
US Value
(14.7%)
The regional value is compared to the national value.
Poor Mental Health: 14+ Days Census Tract: 41065970800
Poor Mental Health: 14+ Days Census Tract: 41065970800
16.8%
(2021)
Compared to:
OR Census Tracts
The distribution is based on data from 825 Oregon census tracts.
U.S. Census Tracts
The distribution is based on data from 68,167 U.S. census tracts.
Wasco, OR County Value
(16.6%)
The regional value is compared to the Wasco County value.
US Value
(14.7%)
The regional value is compared to the national value.
Health / Mental Health & Mental Disorders
Poor Mental Health: Average Number of Days
Value
Compared to:
Poor Mental Health: Average Number of Days County: Hood River
Poor Mental Health: Average Number of Days County: Hood River
5.3
Days
(2021)
Compared to:
OR Counties
The distribution is based on data from 36 Oregon counties.
U.S. Counties
The distribution is based on data from 3,141 U.S. counties and county equivalents.
OR Value
(5.4)
The regional value is compared to the Oregon State value.
US Value
(4.8)
The regional value is compared to the national value.
Prior Value
(4.9)
Prior Value compares a measured value with the previously measured value. Confidence intervals were taken into account in determining the direction of the comparison.
Trend
This comparison measures the indicator’s values over multiple time periods.<br>The Mann-Kendall Test for Statistical Significance is used to evaluate the trend<br>over 4 to 10 periods of measure, subject to data availability and comparability.
Poor Mental Health: Average Number of Days County: Wasco
Poor Mental Health: Average Number of Days County: Wasco
5.4
Days
(2021)
Compared to:
OR Counties
The distribution is based on data from 36 Oregon counties.
U.S. Counties
The distribution is based on data from 3,141 U.S. counties and county equivalents.
OR Value
(5.4)
The regional value is compared to the Oregon State value.
US Value
(4.8)
The regional value is compared to the national value.
Prior Value
(4.9)
Prior Value compares a measured value with the previously measured value. Confidence intervals were taken into account in determining the direction of the comparison.
Trend
This comparison measures the indicator’s values over multiple time periods.<br>The Mann-Kendall Test for Statistical Significance is used to evaluate the trend<br>over 4 to 10 periods of measure, subject to data availability and comparability.
Poor Mental Health: Average Number of Days State: Oregon
Poor Mental Health: Average Number of Days State: Oregon
5.4
Days
(2021)
Compared to:
U.S. States
The distribution is based on data from 50 U.S. states and the District of Columbia.
US Value
(4.8)
The regional value is compared to the national value.
Prior Value
(4.6)
Prior Value compares a measured value with the previously measured value. Confidence intervals were taken into account in determining the direction of the comparison.
Trend
This comparison measures the indicator’s values over multiple time periods.<br>The Mann-Kendall Test for Statistical Significance is used to evaluate the trend<br>over 4 to 10 periods of measure, subject to data availability and comparability.
Health / Mental Health & Mental Disorders
Self-Reported General Health Assessment: Good or Better
Value
Compared to:
Self-Reported General Health Assessment: Good or Better County: Hood River
Self-Reported General Health Assessment: Good or Better County: Hood River
83.6%
(2014-2017)
Compared to:

OR Counties
The distribution is based on data from 33 Oregon counties.
OR Value
(83.0%)
The regional value is compared to the Oregon State value.
US Value
(83.0% in 2022)
The regional value is compared to the national value. The source for the national value is Behavioral Risk Factor Surveillance System
Prior Value
(80.2%)
Prior Value compares a measured value with the previously measured value. Confidence intervals were taken into account in determining the direction of the comparison.
Trend
This comparison measures the indicator’s values over multiple time periods.<br>The Mann-Kendall Test for Statistical Significance is used to evaluate the trend<br>over 4 to 10 periods of measure, subject to data availability and comparability.
Self-Reported General Health Assessment: Good or Better State: Oregon
Self-Reported General Health Assessment: Good or Better State: Oregon
83.0%
(2014-2017)
Compared to:

US Value
(83.0% in 2022)
The regional value is compared to the national value. The source for the national value is Behavioral Risk Factor Surveillance System
Prior Value
(83.1%)
Prior Value compares a measured value with the previously measured value. Confidence intervals were taken into account in determining the direction of the comparison.
Trend
This comparison measures the indicator’s values over multiple time periods.<br>The Mann-Kendall Test for Statistical Significance is used to evaluate the trend<br>over 4 to 10 periods of measure, subject to data availability and comparability.
Health / Mental Health & Mental Disorders
Students who have Attempted Suicide: 11th Graders
Value
Compared to:
Students who have Attempted Suicide: 11th Graders County: Hood River
Students who have Attempted Suicide: 11th Graders County: Hood River
2.9%
(2020)
Compared to:
OR Value
(5.1%)
The regional value is compared to the Oregon State value.
Prior Value
(8.6%)
Prior Value compares a measured value with the previously measured value. Confidence intervals were not taken into account in determining the direction of the comparison.
Trend
This comparison measures the indicator’s values over multiple time periods.<br>The Mann-Kendall Test for Statistical Significance is used to evaluate the trend<br>over 4 to 10 periods of measure, subject to data availability and comparability.
Students who have Attempted Suicide: 11th Graders County: Wasco
Students who have Attempted Suicide: 11th Graders County: Wasco
10.2%
(2020)
Compared to:
OR Value
(5.1%)
The regional value is compared to the Oregon State value.
