
Search for Indicators
Physical Activity and the Outdoors
This dashboard includes basic information about your community covering topics like physical activities and outdoors.
Use the drop-down menu below to see data at different locales.
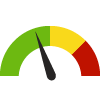
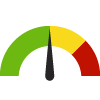
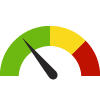
Indicator Gauge Icon Legend
Legend Colors
Red is bad, green is good, blue is not statistically different/neutral.
Compared to Distribution
 the value is in the best half of communities.
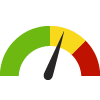 the value is in the 2nd worst quarter of communities.
 the value is in the worst quarter of communities.
Compared to Target
 meets target;
  does not meet target.
Compared to a Single Value
 lower than the comparison value;
 higher than the comparison value;
 not statistically different from comparison value.
Trend

 non-significant change over time;
 significant change over time;
  no change over time.
Compared to Prior Value
 higher than the previous measurement period;
 lower than the previous measurement period;
 no statistically different change from previous measurement period.
County: Wasco
Value
Compared to:
87.9%
Percentage
(2020)
Compared to:

OR Counties
(2019)
The distribution is based on data from 28 Oregon counties.
OR Value
(80.9%)
The regional value is compared to the Oregon State value.
90.6%
Percentage
(2020)
Compared to:
OR Counties
(2019)
The distribution is based on data from 28 Oregon counties.
OR Value
(88.3%)
The regional value is compared to the Oregon State value.
County: Wasco Poor Physical Health: 14+ Days
County: Wasco Poor Physical Health: 14+ Days
12.9%
(2021)
Compared to:

OR Counties
The distribution is based on data from 36 Oregon counties.
U.S. Counties
The distribution is based on data from 3,074 U.S. counties and county equivalents.
US Value
(10.9%)
The regional value is compared to the national value.
42.4%
(2020)
Compared to:
OR Counties
(2019)
The distribution is based on data from 33 Oregon counties.
OR Value
(39.7%)
The regional value is compared to the Oregon State value.
Prior Value
(20.7%)
Prior Value compares a measured value with the previously measured value. Confidence intervals were not taken into account in determining the direction of the comparison.
Trend
This comparison measures the indicator’s values over multiple time periods.<br>The Mann-Kendall Test for Statistical Significance is used to evaluate the trend<br>over 4 to 10 periods of measure, subject to data availability and comparability.
22.7%
(2020)
Compared to:


OR Counties
(2019)
The distribution is based on data from 33 Oregon counties.
OR Value
(31.3%)
The regional value is compared to the Oregon State value.
Prior Value
(26.1%)
Prior Value compares a measured value with the previously measured value. Confidence intervals were not taken into account in determining the direction of the comparison.
Trend
This comparison measures the indicator’s values over multiple time periods.<br>The Mann-Kendall Test for Statistical Significance is used to evaluate the trend<br>over 4 to 10 periods of measure, subject to data availability and comparability.
County: Wasco Students with No Physical Activity: 11th Graders
County: Wasco Students with No Physical Activity: 11th Graders
11.3%
(2019)
Compared to:

OR Counties
The distribution is based on data from 33 Oregon counties.
OR Value
(12.4%)
The regional value is compared to the Oregon State value.
Prior Value
(14.1%)
Prior Value compares a measured value with the previously measured value. Confidence intervals were not taken into account in determining the direction of the comparison.
Trend
This comparison measures the indicator’s values over multiple time periods.<br>The Mann-Kendall Test for Statistical Significance is used to evaluate the trend<br>over 4 to 10 periods of measure, subject to data availability and comparability.
County: Wasco Students with No Physical Activity: 8th Graders
County: Wasco Students with No Physical Activity: 8th Graders
8.7%
(2019)
Compared to:
OR Counties
The distribution is based on data from 33 Oregon counties.
OR Value
(7.5%)
The regional value is compared to the Oregon State value.
Prior Value
(8.6%)
Prior Value compares a measured value with the previously measured value. Confidence intervals were not taken into account in determining the direction of the comparison.
County: Wasco Workers who Walk to Work
County: Wasco Workers who Walk to Work
3.2%
(2018-2022)
Compared to:
OR Counties
The distribution is based on data from 36 Oregon counties.
U.S. Counties
The distribution is based on data from 3,133 U.S. counties and county equivalents.
OR Value
(3.4%)
The regional value is compared to the Oregon State value.
US Value
(2.4%)
The regional value is compared to the national value.
Trend
This comparison measures the indicator’s values over multiple time periods.<br>The Mann-Kendall Test for Statistical Significance is used to evaluate the trend<br>over 4 to 10 periods of measure, subject to data availability and comparability.
County: Wasco Adults with Arthritis
County: Wasco Adults with Arthritis
28.6%
(2021)
Compared to:
OR Counties
The distribution is based on data from 36 Oregon counties.
U.S. Counties
The distribution is based on data from 3,074 U.S. counties and county equivalents.
US Value
(25.2%)
The regional value is compared to the national value.
29.0%
(2022)
Compared to:


OR Counties
The distribution is based on data from 36 Oregon counties.
U.S. Counties
The distribution is based on data from 3,129 U.S. counties and county equivalents.
OR Value
(31.0%)
The regional value is compared to the Oregon State value.
US Value
(35.0%)
The regional value is compared to the national value.
Prior Value
(28.0%)
Prior Value compares a measured value with the previously measured value. Confidence intervals were not taken into account in determining the direction of the comparison.
Trend
This comparison measures the indicator’s values over multiple time periods.<br>The Mann-Kendall Test for Statistical Significance is used to evaluate the trend<br>over 4 to 10 periods of measure, subject to data availability and comparability.
County: Wasco Physical Environment Ranking
County: Wasco Physical Environment Ranking
15
(2023)
Compared to:
OR Counties
The distribution is based on data from 35 Oregon counties.
