
Search for Indicators
Children and Youth
The Children & Youth dashboard includes information about your youth community covering topics like safety, education and health.
Use the drop-down menu below to see data at different locales.
Indicator Gauge Icon Legend
Legend Colors
Red is bad, green is good, blue is not statistically different/neutral.
Compared to Distribution
 the value is in the best half of communities.
 the value is in the 2nd worst quarter of communities.
 the value is in the worst quarter of communities.
Compared to Target
 meets target;
  does not meet target.
Compared to a Single Value
 lower than the comparison value;
 higher than the comparison value;
 not statistically different from comparison value.
Trend

 non-significant change over time;
 significant change over time;
  no change over time.
Compared to Prior Value
 higher than the previous measurement period;
 lower than the previous measurement period;
 no statistically different change from previous measurement period.
 Significantly better than the overall value
 Significantly worse than the overall value
 Significantly different than the overall value
 No significant difference with the overall value
 No data on significance available
County: Wasco
Value
Compared to:
County: Wasco Positive Youth Development Benchmark: 11th Graders
County: Wasco Positive Youth Development Benchmark: 11th Graders
33.3%
(2020)
Compared to:


OR Counties
(2019)
The distribution is based on data from 33 Oregon counties.
OR Value
(49.4%)
The regional value is compared to the Oregon State value.
Prior Value
(68.0%)
Prior Value compares a measured value with the previously measured value. Confidence intervals were not taken into account in determining the direction of the comparison.
Trend
This comparison measures the indicator’s values over multiple time periods.<br>The Mann-Kendall Test for Statistical Significance is used to evaluate the trend<br>over 4 to 10 periods of measure, subject to data availability and comparability.
County: Wasco Positive Youth Development Benchmark: 8th Graders
County: Wasco Positive Youth Development Benchmark: 8th Graders
43.4%
(2020)
Compared to:
OR Counties
(2019)
The distribution is based on data from 33 Oregon counties.
OR Value
(49.4%)
The regional value is compared to the Oregon State value.
Prior Value
(56.3%)
Prior Value compares a measured value with the previously measured value. Confidence intervals were not taken into account in determining the direction of the comparison.
Trend
This comparison measures the indicator’s values over multiple time periods.<br>The Mann-Kendall Test for Statistical Significance is used to evaluate the trend<br>over 4 to 10 periods of measure, subject to data availability and comparability.
County: Wasco Youth not in School or Working
County: Wasco Youth not in School or Working
1.3%
(2018-2022)
Compared to:
OR Counties
The distribution is based on data from 36 Oregon counties.
U.S. Counties
The distribution is based on data from 3,130 U.S. counties and county equivalents.
OR Value
(2.2%)
The regional value is compared to the Oregon State value.
US Value
(1.8%)
The regional value is compared to the national value.
Trend
This comparison measures the indicator’s values over multiple time periods.<br>The Mann-Kendall Test for Statistical Significance is used to evaluate the trend<br>over 4 to 10 periods of measure, subject to data availability and comparability.
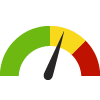
County: Wasco Students who have Attempted Suicide: 11th Graders
County: Wasco Students who have Attempted Suicide: 11th Graders
10.2%
(2020)
Compared to:

OR Value
(5.1%)
The regional value is compared to the Oregon State value.
County: Wasco Students who have Attempted Suicide: 8th Graders
County: Wasco Students who have Attempted Suicide: 8th Graders
5.7%
(2020)
Compared to:
OR Value
(5.6%)
The regional value is compared to the Oregon State value.
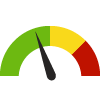
County: Wasco Students who have Considered Suicide: 11th Graders
County: Wasco Students who have Considered Suicide: 11th Graders
26.3%
(2020)
Compared to:
OR Value
(16.5%)
The regional value is compared to the Oregon State value.
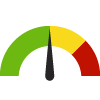
County: Wasco Students who have Considered Suicide: 8th Graders
County: Wasco Students who have Considered Suicide: 8th Graders
17.6%
(2020)
Compared to:
OR Value
(14.4%)
The regional value is compared to the Oregon State value.
County: Wasco Children Living Below Poverty Level
County: Wasco Children Living Below Poverty Level
11.5%
(2018-2022)
Compared to:

OR Counties
The distribution is based on data from 36 Oregon counties.
U.S. Counties
The distribution is based on data from 3,132 U.S. counties and county equivalents.
OR Value
(13.5%)
The regional value is compared to the Oregon State value.
US Value
(16.7%)
The regional value is compared to the national value.
Trend
This comparison measures the indicator’s values over multiple time periods.<br>The Mann-Kendall Test for Statistical Significance is used to evaluate the trend<br>over 4 to 10 periods of measure, subject to data availability and comparability.
134
Average monthly number of children
(2019)
Compared to:

Prior Value
(114)
Prior Value compares a measured value with the previously measured value. Confidence intervals were not taken into account in determining the direction of the comparison.
Trend
This comparison measures the indicator’s values over multiple time periods.<br>The Mann-Kendall Test for Statistical Significance is used to evaluate the trend<br>over 4 to 10 periods of measure, subject to data availability and comparability.
County: Wasco Children with Health Insurance
County: Wasco Children with Health Insurance
95.3%
(2021)
Compared to:

OR Counties
The distribution is based on data from 36 Oregon counties.
U.S. Counties
The distribution is based on data from 3,140 U.S. counties and county equivalents.
OR Value
(96.4%)
The regional value is compared to the Oregon State value.
Prior Value
(94.7%)
Prior Value compares a measured value with the previously measured value. Confidence intervals were taken into account in determining the direction of the comparison.
Trend
This comparison measures the indicator’s values over multiple time periods.<br>The Mann-Kendall Test for Statistical Significance is used to evaluate the trend<br>over 4 to 10 periods of measure, subject to data availability and comparability.
County: Wasco Food Insecure Children Likely Ineligible for Assistance
County: Wasco Food Insecure Children Likely Ineligible for Assistance
13%
(2021)
Compared to:


OR Counties
The distribution is based on data from 36 Oregon counties.
U.S. Counties
The distribution is based on data from 3,134 U.S. counties and county equivalents.
OR Value
(26%)
The regional value is compared to the Oregon State value.
US Value
(25%)
The regional value is compared to the national value.
Prior Value
(17%)
Prior Value compares a measured value with the previously measured value. Confidence intervals were not taken into account in determining the direction of the comparison.
Trend
This comparison measures the indicator’s values over multiple time periods.<br>The Mann-Kendall Test for Statistical Significance is used to evaluate the trend<br>over 4 to 10 periods of measure, subject to data availability and comparability.
County: Wasco Households Receiving SNAP with Children (Count)
County: Wasco Households Receiving SNAP with Children (Count)
893
Households
(2018-2022)
Compared to:

Trend
This comparison measures the indicator’s values over multiple time periods.<br>The Mann-Kendall Test for Statistical Significance is used to evaluate the trend<br>over 4 to 10 periods of measure, subject to data availability and comparability.
County: Wasco Substantiated Child Abuse Rate
County: Wasco Substantiated Child Abuse Rate
11.7
Cases per 1,000 children
(2022)
Compared to:
OR Counties
The distribution is based on data from 34 Oregon counties.
OR Value
(12.4)
The regional value is compared to the Oregon State value.
US Value
(7.7)
The regional value is compared to the national value. The source for the national value is Children's Bureau
Prior Value
(13.2)
Prior Value compares a measured value with the previously measured value. Confidence intervals were not taken into account in determining the direction of the comparison.
Trend
This comparison measures the indicator’s values over multiple time periods.<br>The Mann-Kendall Test for Statistical Significance is used to evaluate the trend<br>over 4 to 10 periods of measure, subject to data availability and comparability.
HP 2030 Target
(8.7)
County: Wasco Children with a Disability
County: Wasco Children with a Disability
6.2%
(2018-2022)
Compared to:

OR Value
(5.2%)
The regional value is compared to the Oregon State value.
US Value
(4.5%)
The regional value is compared to the national value.
Trend
This comparison measures the indicator’s values over multiple time periods.<br>The Mann-Kendall Test for Statistical Significance is used to evaluate the trend<br>over 4 to 10 periods of measure, subject to data availability and comparability.
25.3%
(2020)
Compared to:
OR Counties
(2019)
The distribution is based on data from 28 Oregon counties.
OR Value
(11.9%)
The regional value is compared to the Oregon State value.
87.9%
Percentage
(2020)
Compared to:

OR Counties
(2019)
The distribution is based on data from 28 Oregon counties.
OR Value
(80.9%)
The regional value is compared to the Oregon State value.
7.2%
(2020)
Compared to:
OR Counties
(2019)
The distribution is based on data from 28 Oregon counties.
OR Value
(5.1%)
The regional value is compared to the Oregon State value.
90.6%
Percentage
(2020)
Compared to:
OR Counties
(2019)
The distribution is based on data from 28 Oregon counties.
OR Value
(88.3%)
The regional value is compared to the Oregon State value.
