
Search for Indicators
Social Connection and Communication
This dashboard includes information about your community covering topics like social connections and communication.
Use the drop-down menu below to see data at different locales.
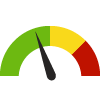
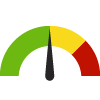
Indicator Gauge Icon Legend
Legend Colors
Red is bad, green is good, blue is not statistically different/neutral.
Compared to Distribution
 the value is in the best half of communities.
 the value is in the 2nd worst quarter of communities.
 the value is in the worst quarter of communities.
Compared to Target
 meets target;
  does not meet target.
Compared to a Single Value
 lower than the comparison value;
 higher than the comparison value;
 not statistically different from comparison value.
Trend

 non-significant change over time;
 significant change over time;
  no change over time.
Compared to Prior Value
 higher than the previous measurement period;
 lower than the previous measurement period;
 no statistically different change from previous measurement period.
County: Wasco
Value
Compared to:
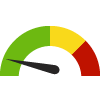
County: Wasco Social Associations
County: Wasco Social Associations
10.1
Membership associations per 10,000 population
(2021)
Compared to:


OR Counties
The distribution is based on data from 36 Oregon counties.
U.S. Counties
The distribution is based on data from 3,141 U.S. counties and county equivalents.
OR Value
(9.8)
The regional value is compared to the Oregon State value.
US Value
(9.1)
The regional value is compared to the national value.
Prior Value
(10.6)
Prior Value compares a measured value with the previously measured value. Confidence intervals were not taken into account in determining the direction of the comparison.
Trend
This comparison measures the indicator’s values over multiple time periods.<br>The Mann-Kendall Test for Statistical Significance is used to evaluate the trend<br>over 4 to 10 periods of measure, subject to data availability and comparability.
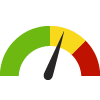
County: Wasco Youth not in School or Working
County: Wasco Youth not in School or Working
1.3%
(2018-2022)
Compared to:
OR Counties
The distribution is based on data from 36 Oregon counties.
U.S. Counties
The distribution is based on data from 3,130 U.S. counties and county equivalents.
OR Value
(2.2%)
The regional value is compared to the Oregon State value.
US Value
(1.8%)
The regional value is compared to the national value.
Trend
This comparison measures the indicator’s values over multiple time periods.<br>The Mann-Kendall Test for Statistical Significance is used to evaluate the trend<br>over 4 to 10 periods of measure, subject to data availability and comparability.
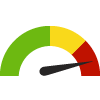
County: Wasco Persons with a Self-Care Difficulty
County: Wasco Persons with a Self-Care Difficulty
4.1%
(2018-2022)
Compared to:


OR Value
(2.8%)
The regional value is compared to the Oregon State value.
US Value
(2.6%)
The regional value is compared to the national value.
Trend
This comparison measures the indicator’s values over multiple time periods.<br>The Mann-Kendall Test for Statistical Significance is used to evaluate the trend<br>over 4 to 10 periods of measure, subject to data availability and comparability.
